


Is Secular Individualism Fueling Disability and Worklessness among White Britons?
Centre for Heterodox Social Science Report No. 2

Around 1 in 5 people of working-age in Britain are out of work or limited in what they can do, a figure which boomed during the pandemic from around 3 million to over 4 million and has not subsided. In some northern towns like Grimsby or Blackpool, economic inactivity among those of working age reaches 1 in 2. This crisis of worklessness is hitting economic growth and sapping the treasury.
The new increase may be rooted in a mental health crisis concentrated among those with low education, whites, and individuals who are unmarried or without religion.
In what follows, I use a British census analysis tool, combined with AI, to show that a decline of community – broadly construed – best accounts for this pattern.
In his magisterial Coming Apart, Charles Murray draws attention to how the residents of upper-middle class ‘Belmont’ (modeled on a toney Boston suburb) were diverging from those of ‘Fishtown’ (based on a historic white working-class area of Philadelphia). The white working-class were leaving religion, failing to get married, and dropping out of the workforce. Murray viewed this crisis as stemming from the decline of a culture of community, religion and the work ethic – though deindustrialization also played a role.
More recently, there has been a sharp increase in reported mental health problems, especially among younger generations. By contrast, physical health has been relatively constant. Figure 1 shows that rates of depression or anxiety have doubled since the early 2000s:

Figure 1
Source: Donnelly, Laura, ‘Britain’s ill-health crisis drives eight million adults out of workforce,’ Telegraph, 24 October, 2024
Let’s now turn to the 2021 Census of England and Wales to examine the complete sample of the population of England and Wales.
Until the ONS releases its individual-level data (for which I am a certified user but which requires me to attend a data centre where I am escorted to the bathroom to ensure I am not copying low cell counts and exposing the fact a rural Welsh Muslim elderly man from a remote village is divorced!) I must rely on crosstabulated aggregate data. Luckily there is a nice new tool from ONS which allows up to five variables per dataset.
First, there is a strong link between disability and economic inactivity. Figure 2 shows that those who are disabled (left chart) are as much as twice as likely to be economically inactive across the age range as those who do not report a disability (right chart). Netting out the 16-18 year-olds, who tend not to be in the labour force, disability has a major impact on economic activity. Thus the economic activity rate is around 50 percent for disabled people aged 25 to 49, and closer to 90 percent for their non-disabled counterparts.

Figure 2
In terms of disability rates, let us consider some headline numbers. Among the working-age population, aged 16-64, the proportion classified as disabled (for mental or physical reasons) under the Equality Act varies as follows:
· 13 percent among those aged 16-24 versus 36 percent among those over 65: a 23-point gap.
· 11 percent among those with a university degree versus 26 percent among those with no qualifications: a 15-point gap.
· 12 percent among married (or civil partnered or widowed) versus 18 percent among single, divorced or never married: a 6-point gap.
· 9 percent among nonwhites versus 14 percent among whites: a 5-point gap.
· 14 percent of men versus 17 percent of women: a 3-point gap.
· 15 percent among those with a religion versus 17 percent among those with no religion: a 2-point gap.
However, there are some more interesting sub-trends once we drill beneath the above figures.
Ethnicity
Consider Figure 3, which shows disability rates by age and ethnicity. We already know from the early 2010s that nonwhites are barely half as likely as whites to claim disability benefit. Whites diverge from Asian and Black groups in precisely the age range most affected by the mental health crisis, 16-24, but extending into those in their 30s and 40s. By contrast, there is no ethnic disability gap at older ages.

Figure 3
Figure 4 narrows to the white population only. It shows that whites who identify as Christian (which is just over half the total but a minority of under a third among the 16-24s), are 4 points less likely than whites who identify as having No Religion to be classed as disabled.

Figure 4
The pattern is similar for blacks, with the religious/nonreligious divide widest at age 16-24, and narrowing thereafter. Note that nonreligious black Britons are much more likely to be of Caribbean than African origin, so this is likely also picking up an ethnic divide within the black community. Also, the share who report no religion is far lower among black young people (around 10 percent) than among white young people (over 50 percent) hence the relatively disabled black secular population does not impact the aggregate black level of youth disability shown in Figure 5.

Figure 5
However, as Figure 6 highlights, for Asians there is a different pattern: no disability gap by religion until we reach older ages, after which it is the seculars who are less likely to be disabled than the religious Hindus, Muslims and Sikhs. Note that the share of seculars among Asians is just over 10 percent for the 16-24s and there are few (around 5 percent) among the elderly so the nonreligious Asian elderly are a very niche population – likely relatively educated and successful and hence less likely to be disabled.

Figure 6
The last few graphs suggest that the youth disability health crisis has been felt most keenly by whites, and, among whites and blacks, by those without religion.
I would add that even when we restrict to the roughly 8 in 10 reporting ‘very good’ or ‘good’ health, we find the same pattern. So this is not about physical health but mental health.
Broadly speaking, white and black Caribbean seculars are most likely to be disabled.
Blacks and Asians almost all have a religion, and even Asians who don’t are likely tied to an ethnic community and its cohesive norms in a way black Caribbeans are not. From a Durkheimian perspective, ethnic communalism insulates most minorities from the mental health crisis which underlies the rise in disability among whites.
Sex
I next want to turn to male-female differences since young women have been most affected by the mental health crisis. Figure 7 compares the age trend by sex for whites, Asians and blacks (moving left to right).
The white pattern shows women becoming more disabled then men in their late teens and early twenties, with the gender gap (distance between the yellow and red lines) narrowing somewhat for the over-50s.
By contrast, there is little or no gender gap among young Asians or young blacks, with the gap only emerging among the elderly. Here again we see white exceptionalism: which I would argue is explained by the mental health crisis impacting more heavily upon young white women than others. This overlays a base pattern in all groups of rising disability with age in which women are affected somewhat more than men.

Figure 7
Thus far the story appears to be that the mental health crisis, centred among young white people, especially women and the nonreligious, is helping to explain rising disability figures.
But there are also a few longstanding base patterns. First, that older people are much more likely than young people to be disabled – which is about biology and generational differences. Second, that those who have physical or insecure jobs are more likely to be disabled. Education level captures this, and is also correlated with class and occupation.
Figure 8 shows that those with university degrees (level 4, orange line) are only half as likely to be disabled as those with no qualifications (red line) among those aged 16-24. This gap widens between age 25 and 50, but then narrows somewhat thereafter. The widest gap is in the prime working years, age 25 to 64.

Figure 8
However, when we look at the ethnic breakdowns in Figure 9, comparing the white chart at left with Asians in the middle and blacks at right, we find that the education gap is larger for whites, especially in the 25-49 age bracket. The raw gap is also larger among white 16-24s than nonwhites of the same age, but the 25-49 difference really stands out. The white working-class have a distinct pattern of being disabled in prime working age, whereas the nonwhite working-class gets disabled mainly in older age.
For minorities, older uneducated people (who are mainly born abroad) are more disabled, possibly reflecting poorer health and aging norms in developing countries. Still, what jumps out is the considerably wider education gap at young and middle age among whites.
The weaker community ties of the white working-class may be producing Murray’s ‘Fishtown’ effect of working-age whites (but less so nonwhites) dropping out of the abled labour force.

Figure 9
Marriage was one indicator that Murray flagged. In Figure, we can see that the single, never married and divorced (orange ‘Other’ lines) are more likely to be disabled across the life course than married, civil partnered or widowed individuals (yellow lines). The age pattern is pretty similar for whites and nonwhites. This the 5-point higher disability level for working-age whites compared to working-age minorities (comparing lines on left and on the right) is not mainly to do with lower rates of marriage or partnering among whites.
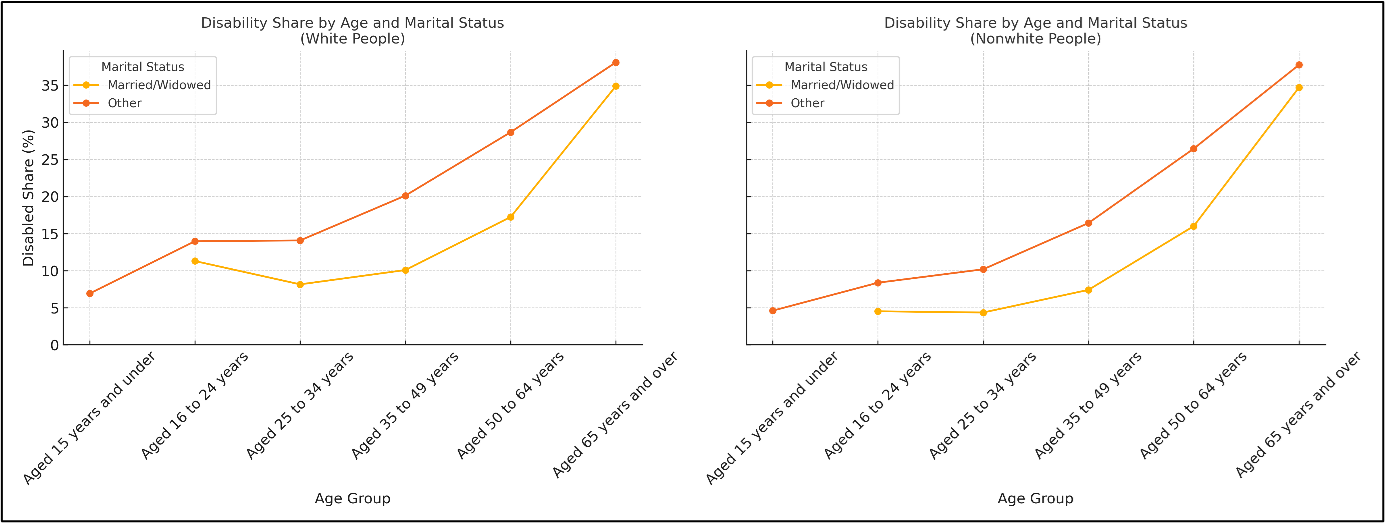
Figure 10
Returning to the issue of the labour force in Figure 11, it is currently the case, among those aged 16-50, that whites (yellow line) are about 10 points more likely to be economically active and employed than Asians (orange) and blacks (red).
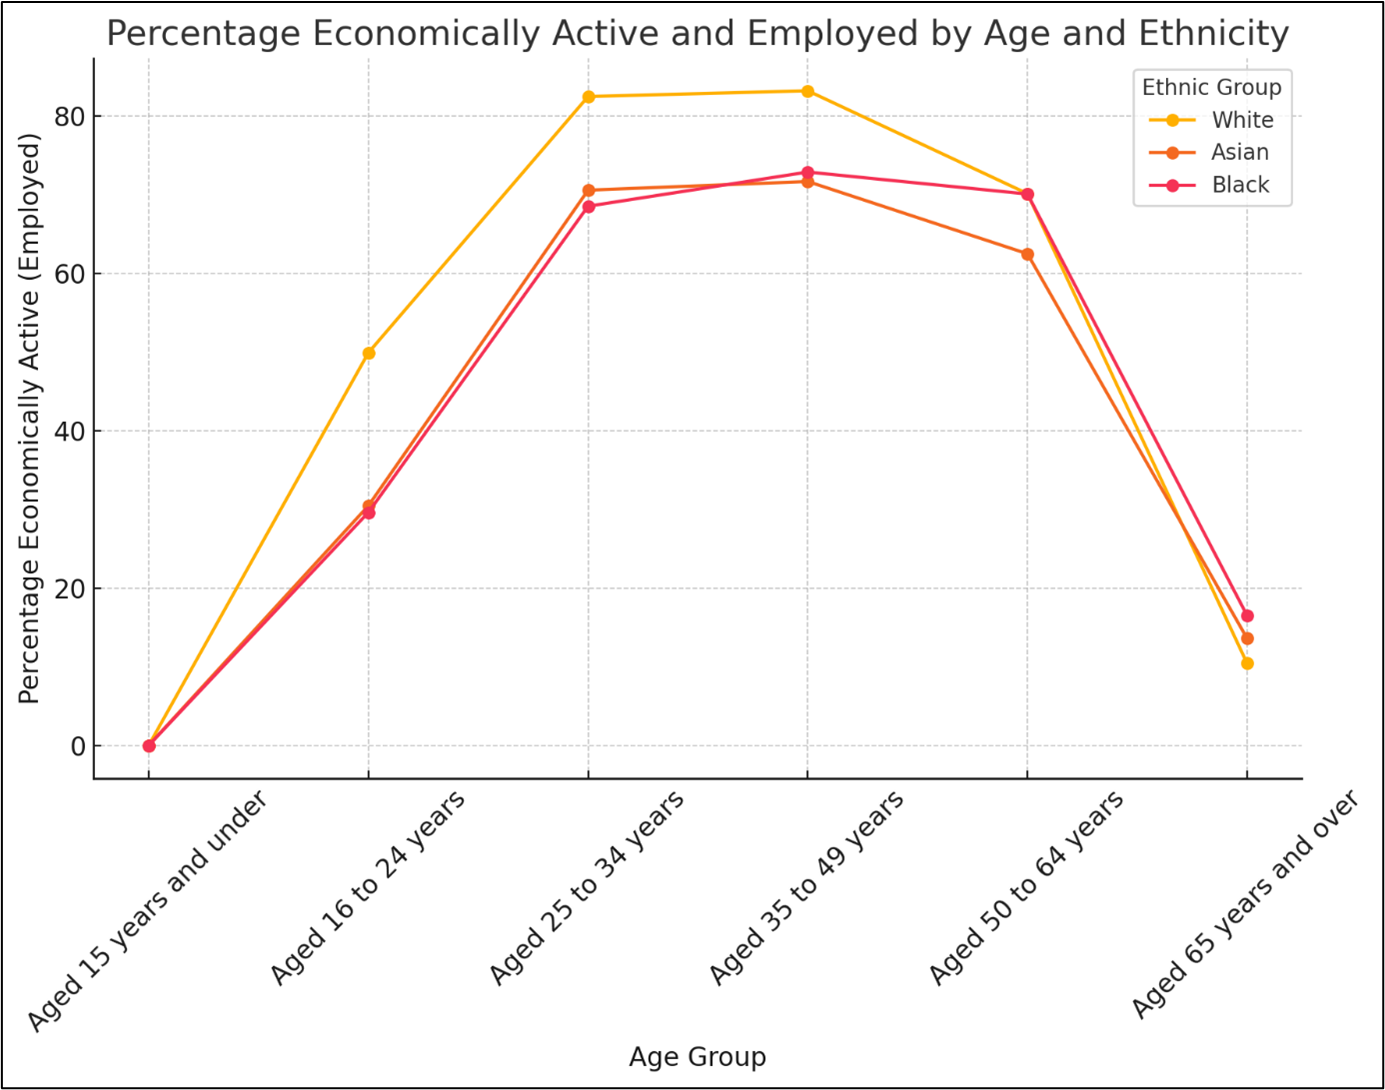
Figure 11
Inactivity levels are higher among minorities across all working age groups and educational categories, as Figure 12 illustrates. The gap is especially noticeable among 16-24 year-olds with university or secondary/college (level 1-3) qualifications, where whites have more than a 20-point advantage (compare green and red curves’ leftmost points across the three charts). The gap is less pronounced in the 30s, 40s and 50s.

Figure 12
However, Figure 13 shows that among those who are disabled (yellow bars), there is no white activity advantage. Only among those who are not disabled (orange bars) do whites have an employment edge. Thus the increase in the share of white disabled is likely to have reduced white labour force activity. This will have a disproportionate effect on the total labour force due to whites being in a substantial majority in Britain.

Figure 13
Conclusion
The number of economically inactive people of working age in Britain increased from just over 3 million to around 4 million as a result of the pandemic and its aftermath.
My analysis of 2021 census data crosstabulations finds that young, secular, white, and black Caribbean people of working age show elevated levels of disability, almost certainly linked to greater mental health problems.
The white working class, defined as whites without educational qualifications, also exhibit elevated disability compared to minority working class or white middle class people. Women and those who are single are also more likely to be disabled. However, these patterns do not show the same youth-centred age profile as those related to ethnicity and religion.
If the UK is to reduce the share of economically inactive individuals, it needs to pay closer attention to the mental health crisis as an economic challenge as well as a health challenge.
The question of what Robert Putnam calls ‘bonding’ social capital, or community connectedness within groups, needs more attention – even as community cohesion between groups (what Putnam calls ‘bridging social capital’) is also vital.
Emile Durkheim, in his classic Suicide, noted that communal structures establish a mental safety net as well as norms which help restrain extreme thoughts and behaviour. Asians, Africans and Christians appear to benefit from this bonding social capital more than secular whites do. Older generations have it more than younger generations and those with higher education more than those without qualifications.
The youth mental health crisis has many sources, from social media, the lack of outdoor play and insufficient social contacts to economic and housing pressures. However, these conditions are also faced by ethnic and religious communities who seem to be managing these strains better than their secular white counterparts. Family structure could be playing a part as well. It may be that increasingly secular whites, and especially the white working class, can learn from minority communities.
In order to tackle disability claims on the system and economic inactivity, we must rebuild the social fabric and a sense of community in an age of individualism.
Download the report as a pdf here.
The demand side is not considered here - will it be addressed later? If work is becoming more cognitive, then fallout in terms of disability and inactvity should be expected. In this way, lower capacity, summarised as lower IQ, is accomodated.
Very interesting. I wonder if a more general decline in any positive identification with the country and its past might also have a bearing on the mental health aspects here, especially concerning the white population and white working class? In part, this would reflect economic restructuring and the loss of traditional industries and allied rooted communities since the 1970s and 80s. But there's also the potentially very pernicious psychological influence of wokeism, especially among the young.
The flip side of the 'sacralization' of certain gender, race and sexual group identities (positive prejudice) is the deliberate 'demonization' of others (negative prejudice). And white English/Welsh groups will bear the brunt of that (e.g. Labour's "Anti-Racist Wales" strategy which prioritises the 'correction' of white bias, white privilege, white racial prejudices etc.).
Growing up in a country in which your own establishment tends to represent you, your country and its past very negatively is hardly conducive to mental well being. This might also be having a negative influence on white people in particular, although it's hard to measure it without asking people about it directly.
A nation is a large body of people UNITED by a common culture, language, history and shared occupancy of a territory. Unity, not diversity, is arguably its strength. A positive or confident identification with that, or even with the IDEA of that (and hence one's sense of purpose and place in the world), might well be supportive of mental well being, even for secular individuals. But the loss of it might also be contributing significantly to some of the poorer outcomes for white people in recent years, especially amongst those who lack the family support networks to build up any compensatory resilience.
Secular individualism might not be such a bad thing in itself, but might serve to make people more vulnerable to the adverse effects of other, potentially more negative, influences that are not being studied directly. This is similar to arguments that are only now starting to be made about 'toxic masculinity' (see below). Practically no work has been done on assessing ITS harmful impacts. These might be worse for those who are socially isolated, but they still impact upon everyone. The same argument could be made in relation to the current prevalence of negative portrayals of 'whiteness' and of our country and its history.
JA Barry (2023). ‘’Toxic masculinity’ is toxic terminology’. Male Psychology, 3 (4), 19-22.